BC Cheating Charts – High Time for Our New Product
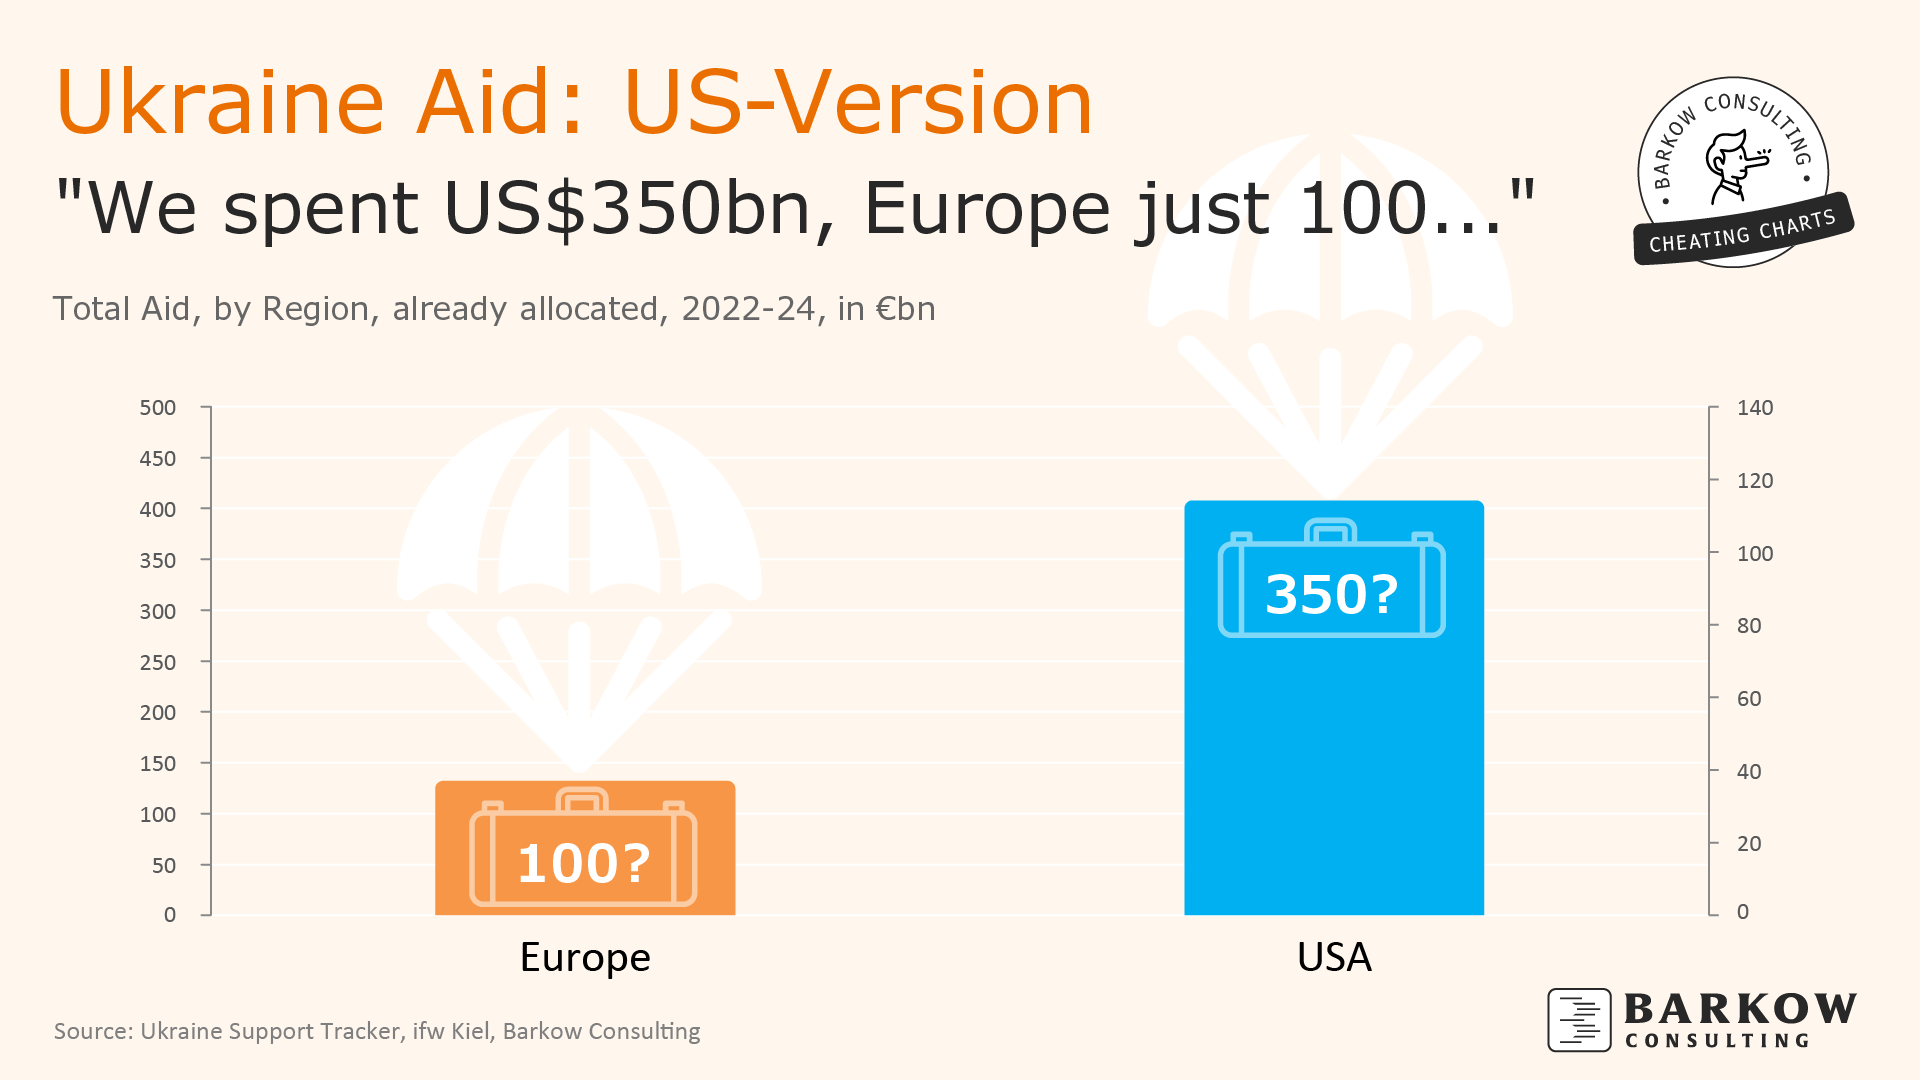
The current occupant of the White House continues to insist that the United States has provided US$350bn in aid to Ukraine, compared to a mere US$100bn from Europe. Impressively, his figures remain remarkably stable – even after being courageously corrected by French President Macron in an act of modern-day numerical heroism.
Unfortunately for the President, the latest Ukraine Support Tracker from the Kiel Institute for World Economics inconveniently reports quite different numbers: Total allocated aid through December 2024 stands at €114bn from the US and €132bn from Europe.
We regret that we cannot directly assist the US President in creating alternative facts – given that our business model explicitly restricts such creative accounting to 1 April each year. But we can at least help him visually justify his preferred narrative with the official launch of our newest product:
BC Cheating Charts!
Employing our advanced visualization expertise, we placed US and European aid figures on separate axes, ingeniously setting Europe’s scale up to €500bn. As demonstrated below, the optical impression now perfectly aligns with the President’s unique numerical worldview.
Voilà, our very first BC Cheating Chart is ready for deployment.
PS:
Hereby, we officially nominate ourselves for the prestigious April edition of the „Unstatistik des Monats“ award from RWI – Leibniz-Institut für Wirtschaftsforschung e.V.